Showing posts with label climate. Show all posts

Wednesday, March 25, 2026

tulip poplar windfall and phenology '26

beekeeping,tulip poplar,white clover,National Phenology Network,climate,chinese wysteria,amur honeysuckle,spiderwort,dandelion,

beekeeping,tulip poplar,white clover,National Phenology Network,climate,chinese wysteria,amur honeysuckle,spiderwort,dandelion,

Spring seems to be arriving a bit early this year—at least in my Atlanta backyard. My records show the first tulip poplar flower windfall appeared on day 84, about 13 days earlier than expected. It’s a small but telling sign that the season is shifting ahead of schedule.

To put this in perspective, I compared my observations with broader indicators like the National Phenology Network’s Spring Bloom Index. This model, based on flowering plants like lilacs and honeysuckles and seasonal temperature patterns, shows that the 2026 spring in Georgia’s Piedmont region is running a few days early compared to the 30-year average.

In other words, what I’m seeing locally matches the bigger picture—spring is getting a head start.

Other Atlanta nectar sources at this time (not shown):


1st Tulip Poplar Windfall Day of Year
10-Apr-2011100
27-Mar-201287
19-Apr-2013109
12-Apr-2015102
15-Apr-2017105
5-Apr-201895
11-Apr-2019101
7-Apr-202197
6-Apr-202296
24-Mar-202383
6-Apr-202497
3-Apr-202593
25-Mar-202684
median97

Monday, February 16, 2026

Climate Prediction 2026

bee,beekeeping,climate,winter,BroodMinder,growing degree days,swarm,

bee,beekeeping,climate,winter,BroodMinder,growing degree days,swarm,
Brood Break Observations in Two Backyard Hives

8-Frame Hive:
This colony experienced a brief brood break from October 19 to November 19, 2025, but showed no noticeable response to the January 10, 2026 cold snap. In fact, a few drones were spotted on February 8. Overall, the colony’s behavior resembles an early spring buildup more than typical winter activity.
5-Frame Hive:
In contrast, the 5-frame colony slowly responded to the January 10 cold spell with an additional brood break. It has recently begun raising internal temperatures back into the brood range of 92°F–98°F, signaling renewed brood rearing. 

Understanding the BroodMinder Graph
The 5-frame hive graph includes three temperature curves:

  • Raspberry curve: Temperature at the top of the lower box
  • Purple curve: Temperature at the top of the second box, just beneath the inner cover. 
  • Red curve: Outdoor temperature from a third-party source

At present, the purple curve remains below brood-zone temperatures, indicating no brood in the upper box. Meanwhile, the raspberry curve has climbed back toward brood-range temperatures following the most recent brood break.

Understanding the Growing Degree Days (GDD) Graph
The smooth brown line represents the multi-decade average of Atlanta’s Growing Degree Day (GDD) accumulation. GDD measures accumulated heat units and can seem abstract at first.
The jagged green line shows the current 2026 GDD. Prior to January 10, it tracked above the brown average line, reflecting warmer-than-normal temperatures. After January 10, the flat section of the green line indicates temperatures below 50°F. At present, the 2026 GDD has returned to near-average levels. In my swarm-obsessed view, average GDD values suggest a typical start to the Atlanta swarm season.

What’s Next?
The outlook from the National Oceanic and Atmospheric Administration offers limited hope for drought relief. For Atlanta, a modest chance of warmer and drier conditions could support foraging activity.  There is always a gray area between long-term climate outlooks and short-term weekly forecasts, so patience will be essential as the 2026 bee season unfolds.
February and March are likely to bring swings between unseasonably warm spells and freezing conditions. During cold, damp, overcast days with no flight activity, it can be unsettling not knowing what’s happening inside the hive. Fortunately, BroodMinder temperature loggers continue to provide valuable insight and reassurance. Stay tuned for further updates as we follow how these colonies navigate an unpredictable winter.

Saturday, April 12, 2025

tulip poplar windfall, other spring flowers and phenology '25


beekeeping,tulip poplar,white clover,National Phenology Network,climate,chinese wysteria,amur honeysuckle,spiderwort,dandelion,

beekeeping,tulip poplar,white clover,National Phenology Network,climate,chinese wysteria,amur honeysuckle,spiderwort,dandelion,
Based on my Atlanta backyard observations and record keeping, I found this year's first Tulip Popular flower windfall a few days early (day 93) - see my table below.  I compared my first tulip poplar windfall observations with other spring surrogates.  The National Phenology Network leaf out model is another way to determine if spring is early, on time, or late.

Spring Leaf Index Anomaly Map uses the first leaf out of cloned lilac and honeysuckle cultivars as these woody plants are among the first to leaf out or bloom and are common across much of the country.  The model also uses temperature and weather events beginning January 1 of each year.  The current spring is compared with a 1991-2020 average. The map shows that the 2025 Georgia Piedmont region's first leaf out day of the year is a few days early compared to the 30-year average.

Other Atlanta nectar sources at this time (not shown):


1st Tulip Poplar Windfall Day of Year
10-Apr-2011100
27-Mar-201287
19-Apr-2013109
12-Apr-2015102
15-Apr-2017105
5-Apr-201895
11-Apr-2019101
7-Apr-202197
6-Apr-202296
24-Mar-202383
6-Apr-202497
3-Apr-202593
median97

Monday, July 15, 2024

water foraging during June 2024 heatwave

bee,beekeeping,collecting water,watering bees,climate,

In Atlanta, June 2024 was both hot and dry.  The daily temperatures were warmer than normal, touching the record high for a few days.  We accumulated 1.74 inches (4.4 cm) of rain compared to a normal June rainfall of 4.54 inches (11.5 cm).  

I rolled out the garden hose and watered daily.  The bees responded by drinking from the birdbath and packing around the edge of the ant moat that hangs above the hummingbird feeder.  

Next, I set out decorative bee-watering items with a dash of kosher salt.  How much salt is enough?  Follow this link to Salt preferences of honey bee water foragers and read that minimal salt is required to attract bees.  The unrelenting heat and the bees' keen memory of their new water source required that I top up the water several times a day.  I added a large chicken waterer 9/10 gal (3.3 liter) with a dash of kosher salt that kept up with the bees and evaporation at the waterer.  In my opinion, the key to attracting water foragers is to provide a permanent and dependable location for water.

NOAA's headline, June marked by record-setting U.S. heat waves, severe weather, highlighted tornados and flash flooding in Florida.   In Atlanta, the June 2024 experience was hot and dry.

bee,beekeeping,collecting water,watering bees,climate,

Tuesday, June 18, 2024

Honey Bee Swarm Seasonality

beekeeping,bee,swarm,climate,Thomas D. Seeley,
Using David Marshall's (MABA’s swarm commander) 2022-2023 Atlanta swarm records I created a histogram graph with eight bins. The raw data has many of days with no swarms and combining two years in a simple graph does not completely patch days with no swarms days or sufficiently smooth the data. The histogram peaks on March 28 ± 10.5 days, and then there is a long tail into the summer months. 
beekeeping,bee,swarm,climate,Thomas D. Seeley,
I discovered a paper, Seasonal Cycle of Swarming in Honeybees, that combined six years of Ithaca, NY swarm emergence dates - I digitized the paper’s Figure 1A.  I created a histogram plot with nine bins. Figure 1A and the resulting histogram graph show a bimodal seasonal pattern – peaking on June 9 ± 7.5 days with a smaller peak in the summer months. 
 
beekeeping,bee,swarm,climate,Thomas D. Seeley,
 
I exchanged emails with one of the authors, Thomas Seeley, and shared how spring frost and fall frost climate data might reconcile these Atlanta and Ithaca swarm peaks. 
  • The Ithaca x-axis contains fewer days than the Atlanta y-axis and is consistent with Ithaca's shorter growing season.
  • In Atlanta and Ithaca, the peak swarm (orange circle) appeared before the local last spring frost.
I’ll leave it to the readers why honey bees in Atlanta don’t have a smaller summer peak like Ithaca – I don’t know. Having a pattern bias has sometimes served me well in making quick decisions, detecting missing data, or spotting corrupted data - what the typical swarm season pattern should look like is still up for grabs!


Saturday, April 6, 2024

tulip poplar windfall, other spring flowers and phenology '24

beekeeping,tulip poplar,white clover,winter,National Phenology Network,climate,chinese wysteria,amur honeysuckle,spiderwort,dandelion,

Click on the image and notice that ants have discovered the tulip poplar flower. These ants are not thought of as pollinators just clever at finding sweets.

Based on my Atlanta backyard observations and record keeping, I found this year's first Tulip Popular flower windfall right on time (day 97) - see my table below.  I'm curious how my first tulip poplar windfall observations correlate with other spring surrogates?  The National Phenology Network leaf out model is another way to determine if spring is early, on time, or late.

Spring Leaf Index Anomaly Map uses the first leaf out of cloned lilac and honeysuckle cultivars as these woody plants are among the first to leaf out or bloom and are common across much of the country.  The model also uses temperature and weather events beginning January 1 of each year.  The current spring is compared with a 1991-2020 average. The map shows that the 2024 Georgia Piedmont region's first leaf out day of the year is similar to the 30-year average - spring is on time in the Georgia Piedmont region and surrounding regions show that spring is a few days early.

Other Atlanta nectar sources at this time (not shown):


1st Windfall day of year
April 10, 2011 100
March 27, 2012 87
April 19, 2013 109
April 12, 2015 102
April 15, 2017 105
April 5, 2018 95
April 11, 2019 101
April 7, 2021 97
April 6, 2022 96
March 24, 2023 83
April 6, 2024 97
median 97
Made with HTML Tables

Friday, September 22, 2023

nematodes as a biologic control

beekeeping,southeastern insecectories,bee,Small Hive Beetle,Beneficial Nematodes,climate,

On December 24, 2022, Atlanta experienced a historic single digit 8°F (-13.3°C) minimal temperature.  This cold snap turned green ground cover brown and likely pushed small hive beetles (SHB) deeper into hives and compost piles. 

My bee yard has high shade, good soil moisture, and summer soil temperatures for SHB reproduction.  I used biological control, Beneficial nematodes (Heterorhabditis Indica), to treat the soil for SHB larvae.   At dusk, I watered the liquid nematode suspension onto the soil.  Direct sunlight (UV light) is fatal to nematodes.

It's one thing to see and squash adult SHBs with my hive tool and another stranger thing to take a leap of faith releasing after dark 'The Smallest Show on Earth' -  Step Right Up! Step Right Up!

  • Moved the insulated FedEx mailer with 2.5 million microscopic nematodes to the refrigerator. 
  • Removed the leaf litter at the hive locations and then wet the soil.  
  • The next step was washing nematodes from gel transport material - small gel pieces can clog the watering can.   I used a large strainer with a fine mesh to remove and rinse the numerous gel pieces.
  • Added more water to the bucket and stirred it to keep the nematodes from settling to the bottom.
  • At dusk, I watered the biologic control onto the soil.

Friday, March 24, 2023

tulip poplar windfall and other spring flowers '23

tulip poplar,white clover,chinese wysteria,amur honeysuckle,spiderwort,dandelion,climate,winter,beekeeping,
NOAA headlines
  • February 2023 was Earth’s 4th warmest on record
  • Europe saw its second-warmest winter as global sea ice set a new record low

I found this year's first Tulip Popular flower windfall 16 days earlier than expected.  This early arrival was most likely driven by weather/climate.  My observation biases that might undermine the hypothesis:

  • I'm better at spotting windfall flowers
  • more time spent outdoors and less time commuting to work
Other nectar sources at this time (not shown):

1st Windfallday of year
April 10, 2011100
March 27, 201287
April 19, 2013109
April 12, 2015102
April 15, 2017105
April 5, 201895
April 11, 2019101
April 7, 202197
April 6, 202296
March 24, 202383
  
median99

Sunday, October 3, 2021

goldenrod 2021

beekeeping,bee,fall,pollen,volatile organic compounds,foraging,climate,goldenrod,

beekeeping,bee,fall,pollen,volatile organic compounds,foraging,climate,goldenrod,

beekeeping,bee,fall,pollen,volatile organic compounds,foraging,climate,goldenrod,

Along the Atlanta BeltLine, I saw tall upright yellow flowering Goldenrod plants in sunny areas - see photos.

In recent fair weather, honey bees flew vigorously and returned with yellow pollen seen in the photo collage and I noticed a stronger and sour hive odor consistent with Goldenrod forage. 

In late afternoons, I saw a huge number of bees circulating at the sunny hive entrance, busy in orientation flight.  In Atlanta, there are potentially many more weeks of flowering Goldenrod left assuming more fair weather.  This gives me hope that the hive will have lots of bees going into winter.

Will there be a fall honey harvest?  Stay tuned.

Saturday, January 23, 2021

pollen color and winter 2020-2021

beekeeping,bee,pollen,growing degree days,foraging,winter,climate,

Here I'm using Growing Degree Days (GDD) to compare this Atlanta winter with previous winters. I calculated GDD using a web based calculator.  As seen in the table, this winter's GDD are much smaller than last year, with the nearest similar winter GDD found in 2013-2014. 

beekeeping,bee,pollen,growing degree days,foraging,winter,climate,

beekeeping,bee,pollen,growing degree days,foraging,winter,climate,
The back yard bees currently return with bright orange pollen and infrequently return with grey pollen - click on the image to enlarge. I'm using a wiki page of pollen colors of plants in hardiness zone 5, while Atlanta is found in plant hardiness zone 7 which presents challenges when comparing:

  • plant flowering dates
  • matching pollen color with a limited number of trees and plants

Other than color, I'm not able to analyze the bright orange pollen, but it's most likely sourced from winter-flowering ornamental cherry trees blooming in the neighborhood and attracting honey bees.

Using binoculars, I see that red maple trees are not yet flowering.  With evidence from previous years, I'll guesstimate that rosemary is the source of the grey pollen.

Sunday, January 10, 2021

R value of soft wood

beekeeping,bee,hive wrap,condensation,winter,bee cozy,climate,darwinian beekeeping,cloake board,
In cold 30℉ weather, condensation is seen at the top vent and cloake board entrance. Warm moist air exiting from these locations are 11℉ warmer than the outside air and this resulted in a large drops of condensation and a wet cloake board landing area.  Foam board insulation above the inner cover and R8 Bee Cozy hive wrap enhances condensation outside of the hive - not inside the hive. Compared to home building codes, R8 insulation does not seem large, but this hive wrap is a wind break and equivalent to 6 inches (15cm) of soft wood. This equivalent hive wall thickness is more like a natural tree cavity wall thickness.

Friday, December 25, 2020

insulated hive wrap and cloake board stack


beekeeping,bee,hive wrap,condensation,winter,bee cozy,respiration,climate,arctic oscillation,cloake board,

beekeeping,bee,hive wrap,condensation,winter,bee cozy,respiration,climate,arctic oscillation,cloake board,

In Atlanta, cold 20°F temperatures arrived on Christmas Day and the ensemble of 11 arctic oscillation forecast a large negative downturn. I used these metrics as significant evidence that winter temperatures are here to stay.  Since 2010, I have reused my NOD Bee Cozy R8 insulated hive wraps  and believe hive wraps improved the chance of overwintered bee hive survival. As a lazy (aka stubborn) beekeeper and despite warm winter fluctuations, I'll leave the Bee Cozy on till spring 2021.

Photo shows joined hives - overwintered hive below and a March 23rd spring swarm capture above an open Cloake Board. The bee cozy is designed for 10-frame equipment, so it easily slipped over the Bloake Board without removing 8-frame boxes. 

I'm encouraged to see warm moist air (bee respiration) condense outside the hive at the top vent and Cloake Board Entrance. 

Here are current the hive elements:

Monday, June 8, 2020

6 consecutive years of early tropical storms

climate, rainfall, SpaceX, spring,
NOAA writes in Assessing the U.S. Climate in May 2020,  

"Tropical storms Arthur and Bertha formed on May 16 and 27, respectively, which is a record sixth consecutive season for at least one named storm to form in the North Atlantic Basin before the official start of the hurricane season on June 1."

"Widespread 4-8 inch rainfall totals on May 25-26 across southern Florida, associated with Tropical Storm Bertha, brought flooding to Miami and its suburbs."

"Miami reported 7.40 inches of rain on May 26 — the third largest 1-day May total for the city and the 10th largest 1-day total observed for any month on record."

"Miami had its wettest May on record with 18.89 inches, breaking the record of 18.54 inches from May 1968."


NASA scrubbed the SpaceX Falcon 9 rocket due to Arthur affecting the recovery area in the Atlantic. After 6 consecutive years of early tropical storms, perhaps it's time to move the official start of the hurricane season to mid-May. 

Thursday, March 12, 2020

Sixth warmest winter on record for contiguous U.S.


bee, beekeeping, climate, dandelion, checkerboarding, winter, bee cozy
In "Assessing the U.S. Climate in February 2020", NOAA writes,
  • December through February was much warmer than normal across the contiguous United States, while precipitation remained above-average. 
  • Georgia ranked second wettest, while Alabama and North Carolina ranked third wettest.
  • Alabama and Georgia had their wettest winter on record, while South Carolina saw its second wettest.
NOAA's summary match my Atlanta weather experience and is consistent with the early arrival of flowering trees and plants.  I don't commonly see bees on dandelion flowers (many neighbors use lawn herbicides).   Wikipedia lists the  pollen color of  dandelion as "red yellow, orange" and typically flowering in  Apr-May.

Today, I removed the bee cozy hive wrap and checker-boarded the honey cap of my hives. From the top box, I swapped half of my drawn frames with no-comb foundationless frames.   The removed drawn frames are added to a new top box where half of the frames are no-comb foundationless.  I first learned about this beekeeping practice in 2015 where Steve Page spoke at Georgia Beekeepers Association.

Saturday, November 23, 2019

2019 - fall hive weight and water balance calculator

  • graph 1 - dramatic 2019 fall hive weight gain
  • graph 2 - flat to decreasing 2018 fall hive weight
  • water balance calculator table - 2019 shows a slightly positive fall water balance compared to past years, while 2018 shows a dramatically wet fall water balance
Many factors contribute to fall hive weight gain, but I speculate that that dry conditions favored optimal goldenrod and aster honey bee forage; sadly these dry conditions stressed shrubs and trees.  Local fall water balance appears to slowly cycle with a period of 3 to 4 years, meaning that fall 2020 might also be dry - stay tuned.
bee, beekeeping, bloom, climate, goldenrod, hive weight, water balance calculator, aster, foraging,

Monday, February 25, 2019

2019 spring bloom markers

This Atlanta spring has been like no other year, nor have we ever experienced an average spring.    Yet, I want a rough guide to plan my spring beeyard tasks.   At the moment, hives are in a winter configuration with bee cozy hive wraps and bradford pear and redbud trees blooming.

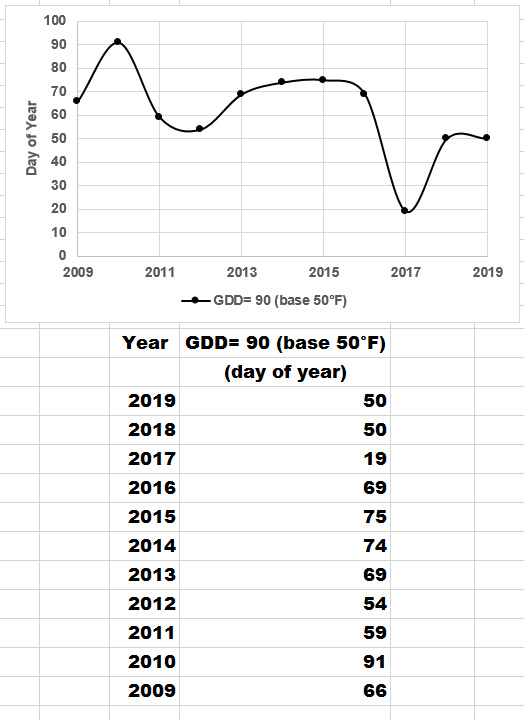
On February 21st, Atlanta pollen count exceeded 1000 which coincided with a Growing Degree Days (GDD) of 90. I'll use GDD equal to 90 and compare this spring with previous years. I calculated GDD using data from the University of Georgia Automated Weather Network.  I'll also use Julian Day  which converts a MMM-DD-YYYY date format which spans 4 months (January to April) into a seamless day of year format.

In the graph notice:
  • similar Day of Year values between this year and 2018
  • warm 2017 outlier which reached a GDD equal to 90 on January 19
bee, bee cozy, beekeeping, bloom, Bradford Pear, climate, growing degree days, pollen count, redbud tree,

bee, bee cozy, beekeeping, bloom, Bradford Pear, climate, growing degree days, pollen count, redbud tree,

Sunday, August 26, 2018

Atlanta Community Food Bank

bee, beekeeping, climate, Atlanta community food bank, honey, spring, crush and strain, flowers
A long term goal met - an Atlanta Community Food Bank donation of 21 lbs of honey.   In 2017 there was no surplus honey.   This year, the favorable spring climate helped the flowers and honey bees produce lots of surplus honey - enough for friends, neighbors and the Food Bank.  Thank you to all my friends who helped with the crush and strain harvesting.

Please visit the Food Bank. Today's Food Bank is more sophisticated than a warehouse and distribution center for macaroni and cheese boxes or canned goods.   

Sunday, March 25, 2018

2018 spring bloom markers


Acer palmatum, bee, beekeeping, bloom, Bradford Pear, Carolina Cherry Laurel, Carpenter Bees, climate, growing degree days, pollen count,
I was hoping to simplify my tracking of spring bloom markers, but instead I added another marker, Growing Degree Days (GDD), which is easy to calculate using free web-based tools.  Julian Day allows me to convert MM-DD-YYYY date format which spans 3 months (February to April) into a seamless day of the year format. GDD is a major convenience, I can tap into a database of daily temperature minimum and maximum instead of recording my own observations.  Focusing on the last two graph points, the accumulated warming this year is roughly 25 days delayed compared to last year (84 versus 59).
Acer palmatum, bee, beekeeping, bloom, Bradford Pear, Carolina Cherry Laurel, Carpenter Bees, climate, growing degree days, pollen count,
Here I compare additional observations with GDD, 1) Acer leaf-out in my backyard and 2) first day that the pollen count exceeds 1000.  Notice how well these markers follow similar graph trends.
Acer palmatum, bee, beekeeping, bloom, Bradford Pear, Carolina Cherry Laurel, Carpenter Bees, climate, growing degree days, pollen count,
Here I show a free web-based tool by AgroClimate which compares this year's GDD to the previous year.  Reading from left-to-right, notice where the curves depart - last year's accumulated warming began in mid January, approximately 30 days earlier than this year.  If the daily high does not exceed 50°F, then the daily contribution to accumulated GDD is zero - the curve does not grow in height. I love this graph layout, but I can't use this tool to go back further in history. This tool can draw the average GDD (not shown), but we all know that no such thing exists in the wild - we have never experienced an average year of weather.
Acer palmatum, bee, beekeeping, bloom, Bradford Pear, Carolina Cherry Laurel, Carpenter Bees, climate, growing degree days, pollen count,
Here I show a free web-based tool by Weather Underground which I used to calculate GDD beyond the previous year in history.  In previous years, I kept the starting point equal to January 1, and I change the ending point in a trial and error manner to achieve a GDD value close to 296.  Why 296 - this is the GDD value where the Atlanta pollen count exceeds 1000 this year.

                     2009 2010 2011 2016 2017 2018 
                      day  day  day  day  day  day
Bradford Pear          65   79   60        56   53
Carpenter Bees         68   87   72        63   77
Acer palmatum leaf out 73   92   77        64   76
Carolina Cherry Laurel 73   97   83        57   76
Pollen Count over 1000                76   51   84
GDD=296 (base 50°F)    92  104   93   84   59   84
Here I show other values that do not appear in the graphs.

Tuesday, January 2, 2018

bomb cyclone

bee, bee cozy, beekeeping, climate, cloake board, condensation, respiration, telescoping cover, ventilation, winter,
Winter storm Grayson brought cold temperatures to Atlanta, but no snow.  Use this link to see NOAA's satellite image.

Here's a photo of the upside down telescoping cover.  Warm moist bee respiration which left the inner cover notch, condenses on the cold telescoping cover and froze as a white ring.  Click the image for more detail.

17 °F temperatures encouraged me to add the bee cozy hive wrap now.    The hive wrap is designed for 10 frame equipment, so easily slips over my 8 frame boxes and cloake board.   I'm overwintering a tall vertical double stack of hives.   The stack contains a cloake board, where I removed the cloake board's sliding floor leaving its queen excluder to separate the two hives.  I added two overlapping cozys on the upper large stack of boxes and one cozy to cover the smaller lower stack of boxes.

From the bottom up, here are the hive elements at this time.
  • screen bottom board with counting board insert removed
  • 1 bee cozy hive wrap surrounding 1 deep box and 3 medium boxes 
  • cloake board with integrated queen excluder and sliding floor removed
  • 2 overlapping bee cozy hive wraps surrounding 2 deep boxes and 3 medium boxes
  • inner cover with top notch ventilation
  • two sheets of 3/4 inch XPS insulation 
  • telescoping cover
  • white corrugated plastic sheet overhang
  • concrete pavers on top

Wednesday, October 18, 2017

CO2, staple food and goldenrod pollen

A Living on Earth radio article draws a connection between atmospheric carbon and the nutritional value of staple food.  Staple foods grown in elevated concentrations of CO2 result in a decrease of iron, zinc and protein.   These results are reproduced in an experiment where staple foods are grown in a CO2 controlled environment.

This time of year, the hives have a stinky smell.  Imagine the smell of hiking boots or dirty gym socks.  Strong un-sweet notes can be found in pockets around the hives.  I have goldenrod to thank for this smell.  Goldenrod is a vital late summer forage for honey bees.  I was surprised to see that this radio article also speaks to how goldenrod protein decreases as CO2 increases.  Goldenrod pollen samples taken now have 30% less protein than samples from 1850's.  In the same way, these results are reproduced in an experiment where goldenrod is grown in a CO2 controlled environment.

Have a look at the graph showing the CO2 increase since the 1850's.  I expect a further decline of staple foods and goldenrod nutrition in the future.
bee, beekeeping, climate, CO2, foraging, goldenrod, nutrition, pollen, staple food,