Showing posts with label pollen count. Show all posts

Monday, February 25, 2019

2019 spring bloom markers

This Atlanta spring has been like no other year, nor have we ever experienced an average spring.    Yet, I want a rough guide to plan my spring beeyard tasks.   At the moment, hives are in a winter configuration with bee cozy hive wraps and bradford pear and redbud trees blooming.

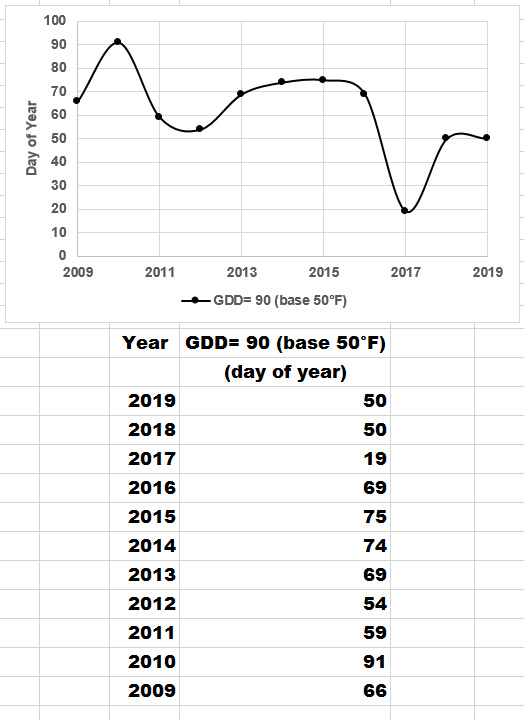
On February 21st, Atlanta pollen count exceeded 1000 which coincided with a Growing Degree Days (GDD) of 90. I'll use GDD equal to 90 and compare this spring with previous years. I calculated GDD using data from the University of Georgia Automated Weather Network.  I'll also use Julian Day  which converts a MMM-DD-YYYY date format which spans 4 months (January to April) into a seamless day of year format.

In the graph notice:
  • similar Day of Year values between this year and 2018
  • warm 2017 outlier which reached a GDD equal to 90 on January 19
bee, bee cozy, beekeeping, bloom, Bradford Pear, climate, growing degree days, pollen count, redbud tree,

bee, bee cozy, beekeeping, bloom, Bradford Pear, climate, growing degree days, pollen count, redbud tree,

Sunday, March 25, 2018

2018 spring bloom markers


Acer palmatum, bee, beekeeping, bloom, Bradford Pear, Carolina Cherry Laurel, Carpenter Bees, climate, growing degree days, pollen count,
I was hoping to simplify my tracking of spring bloom markers, but instead I added another marker, Growing Degree Days (GDD), which is easy to calculate using free web-based tools.  Julian Day allows me to convert MM-DD-YYYY date format which spans 3 months (February to April) into a seamless day of the year format. GDD is a major convenience, I can tap into a database of daily temperature minimum and maximum instead of recording my own observations.  Focusing on the last two graph points, the accumulated warming this year is roughly 25 days delayed compared to last year (84 versus 59).
Acer palmatum, bee, beekeeping, bloom, Bradford Pear, Carolina Cherry Laurel, Carpenter Bees, climate, growing degree days, pollen count,
Here I compare additional observations with GDD, 1) Acer leaf-out in my backyard and 2) first day that the pollen count exceeds 1000.  Notice how well these markers follow similar graph trends.
Acer palmatum, bee, beekeeping, bloom, Bradford Pear, Carolina Cherry Laurel, Carpenter Bees, climate, growing degree days, pollen count,
Here I show a free web-based tool by AgroClimate which compares this year's GDD to the previous year.  Reading from left-to-right, notice where the curves depart - last year's accumulated warming began in mid January, approximately 30 days earlier than this year.  If the daily high does not exceed 50°F, then the daily contribution to accumulated GDD is zero - the curve does not grow in height. I love this graph layout, but I can't use this tool to go back further in history. This tool can draw the average GDD (not shown), but we all know that no such thing exists in the wild - we have never experienced an average year of weather.
Acer palmatum, bee, beekeeping, bloom, Bradford Pear, Carolina Cherry Laurel, Carpenter Bees, climate, growing degree days, pollen count,
Here I show a free web-based tool by Weather Underground which I used to calculate GDD beyond the previous year in history.  In previous years, I kept the starting point equal to January 1, and I change the ending point in a trial and error manner to achieve a GDD value close to 296.  Why 296 - this is the GDD value where the Atlanta pollen count exceeds 1000 this year.

                     2009 2010 2011 2016 2017 2018 
                      day  day  day  day  day  day
Bradford Pear          65   79   60        56   53
Carpenter Bees         68   87   72        63   77
Acer palmatum leaf out 73   92   77        64   76
Carolina Cherry Laurel 73   97   83        57   76
Pollen Count over 1000                76   51   84
GDD=296 (base 50°F)    92  104   93   84   59   84
Here I show other values that do not appear in the graphs.