During past and this summer, I have been able to smell the backyard hives, but the human nose is not designed to quantify or map a smell - see this link about Olfactory Fatigue. Here's how I compared the smell of 3 hives and compared each hive smell to background using a Volatile Organic Compound (VOC) sensor.
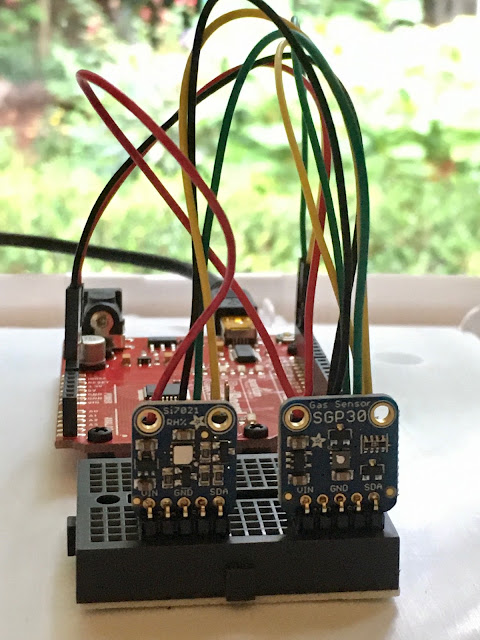
I purchased 2 breakout boards by adafruit, one measures VOC concentration and the other measures temperature and humidity. Seen in the photos:
- two breakout boards plugged into a mini stick-on breadboard
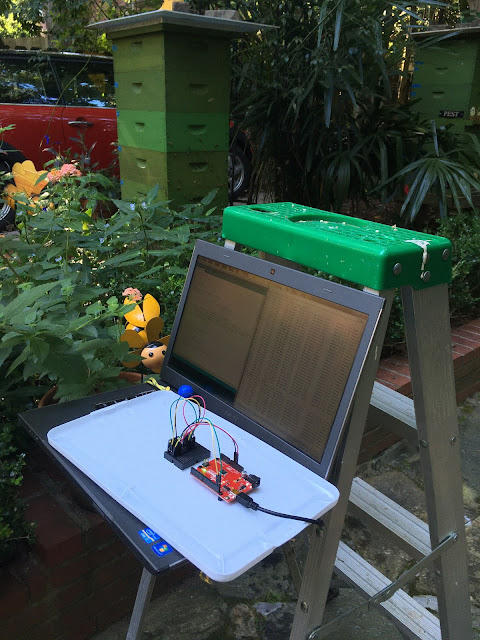
- red colored sparkfun arduino microprocessor attached to an upside down white plastic storage lid using black nylon standoffs by adafruit
- a mini serial cable connecting the microprocessor and laptop
- laptop attached to the ladder's paint-tray using a bungee cord
- chalk marked or flagged a 6 x 4 grid surrounding 3 hives - 4 grid points are skipped due to large shrubs
- selected a day with no wind so as not to disperse the VOC which pool near the hives
- selected an evening to avoid when most flowering plants produce VOC
- warmed-up the sensor system outdoors for an hour before sampling
- setup at a grid point, and sampled for 60 seconds. I stepped away from the 6 x 4 grid during sampling as my body both produces and disperses VOC
- after sampling 20 grid points, I repeated the first 5 grid points to examine reproducibility
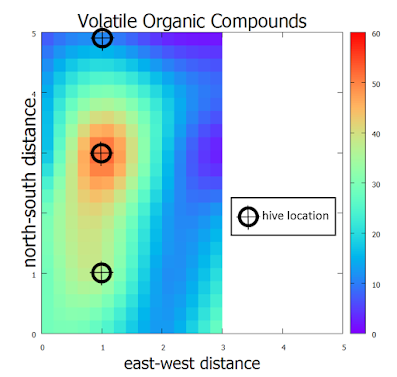
- VOC are shown in parts per billion (ppb) units. As I do not have access to a reference gas mixture, you can think of these VOC values as relative values.
- The central (middle) hive had the highest concentration of VOC. This hive is a massive stack of boxes with 2 queens separated by a cloake board. On the bottom of this stack is an over wintered hive. On the top of this stack is a medium size swarm catch (March 23, 2020).
- A VOC plume from the central hive merged with the hive shown at the bottom of the map. The hive at the bottom of the map is a large overwintered hive.
- The hive at the top of the map is inconsequential in VOC production and resembles a background value. This hive is a tiny swarm catch (March 13, 2020).


No comments:
Post a Comment