Last year as an impulse buy, I purchased an inexpensive RadioShack Waterproof Pocket IR Thermometer. This budget gadget has a limited range, so get close to your target when taking a temperature reading. At dawn I record the top vent and concrete paver temperature. The paver sits on top of the hive and acts as a surrogate for smoothed outdoor air temperature. The top vent temperature acts as surrogate for bee respiration temperature. Imagine this - on cool mornings, the bees are tucked inside the hive, cold air flows into the entrance and screened bottom while warm moist bee respiration exits the top vent - sometimes I discover the warm moist air condensed to the outside of the hive cover - see photo.
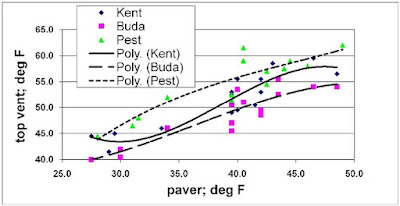
What is the relationship between outdoor air and bee respiration temperature? During a cool morning, the respiration temperature is greater than the air temperature. In other words, all graph points (and trend lines) lie above the y= x line. For example, a dead hive plots on the y= x line. Bee respiration temperature decreases with decreasing outdoor temperature - this is consistent with air exiting the top vent as a mixture of fresh air and bee respiration. In other words, the warm bee respiration is diluted by cooler fresh air.
How do the hives differ? Three hives (Kent, Buda and Pest) are located in a row, but each has a unique amount of shade and access to morning sunshine.
- Pest's third order polynomial trend line respiration temperature is warmer than the other hive trend lines. Probably Pest has the largest bee population. Pest is a 2011 swarm, captured with the help of Cassandra and John. Pest is a powerful force of nature - what Cassandra refers to type A behavior.
- Kent's trend line respiration is less warm than the Pest trend, yet Kent usually flys more vigorously than the other hives. FYI, Kent receives more morning sunshine than the other hives. My range of temperature measurements (Nov 18th to Dec 3rd) contains many stretches where the mid-day outdoor temperature is too low for foraging. Perhaps Kent's interesting sigmoid trend line represents 1) winter clustering in the flat lower left region, 2) typical non-clustered state in the flat upper right region and 3) a sloped line which represents a continuum of changes connecting these end-points.
- Buda's trend line respiration is cooler than the other two hives. Buda is a 2012 spring split. Probably Buda has the smallest bee population compared to the other over-wintered hives.


No comments:
Post a Comment